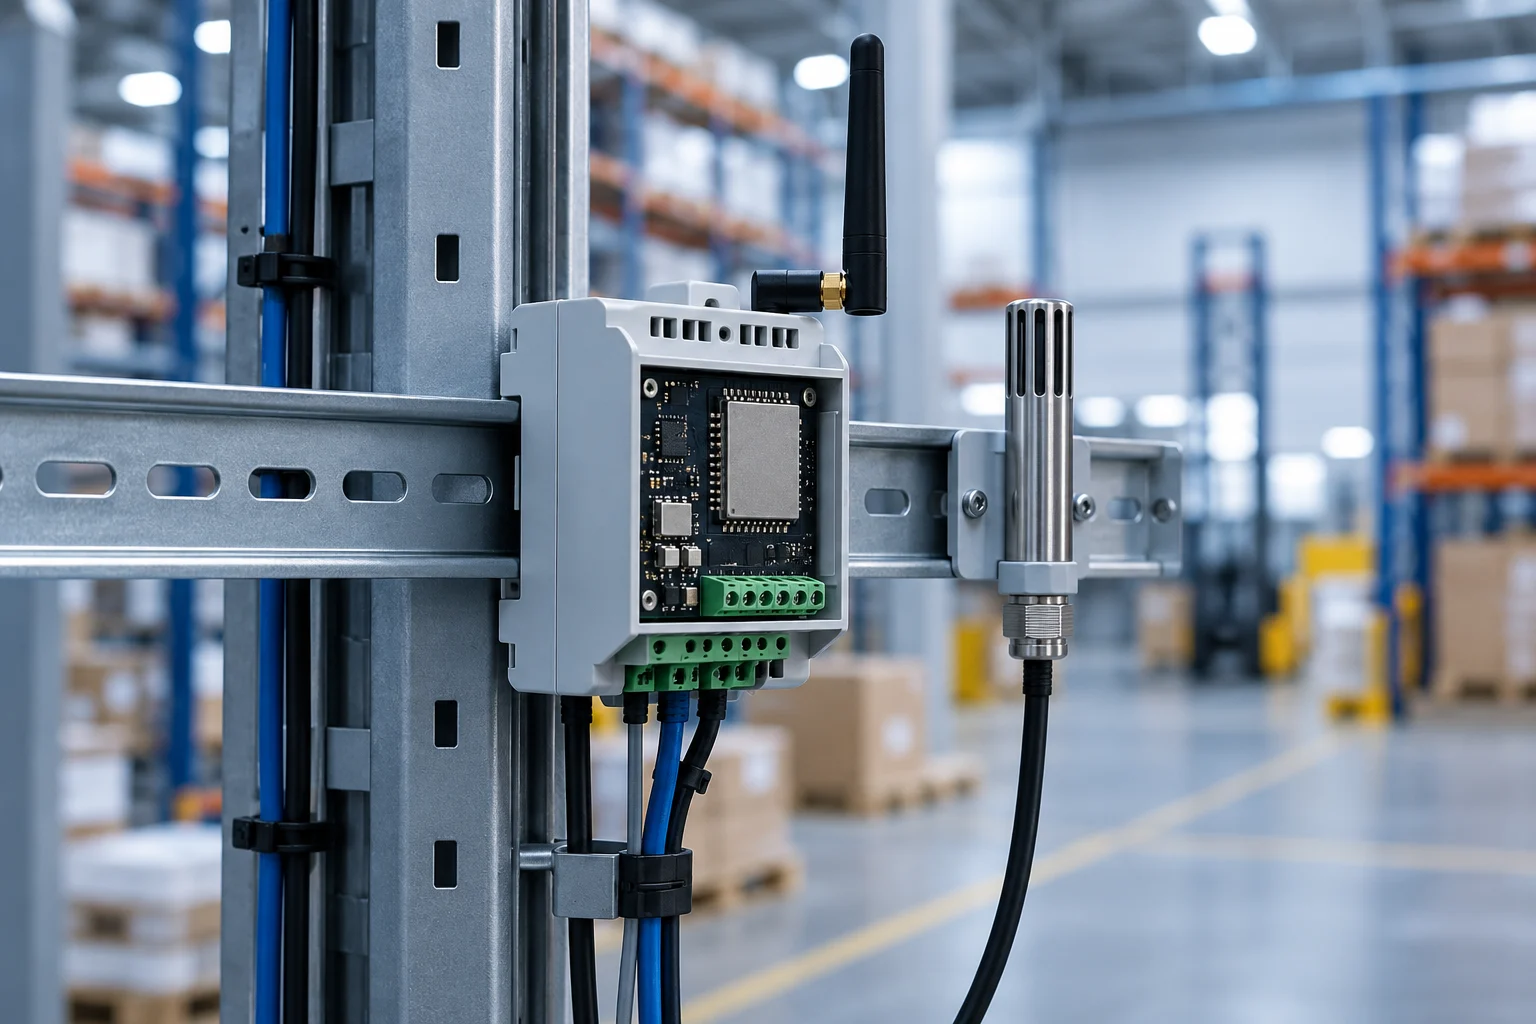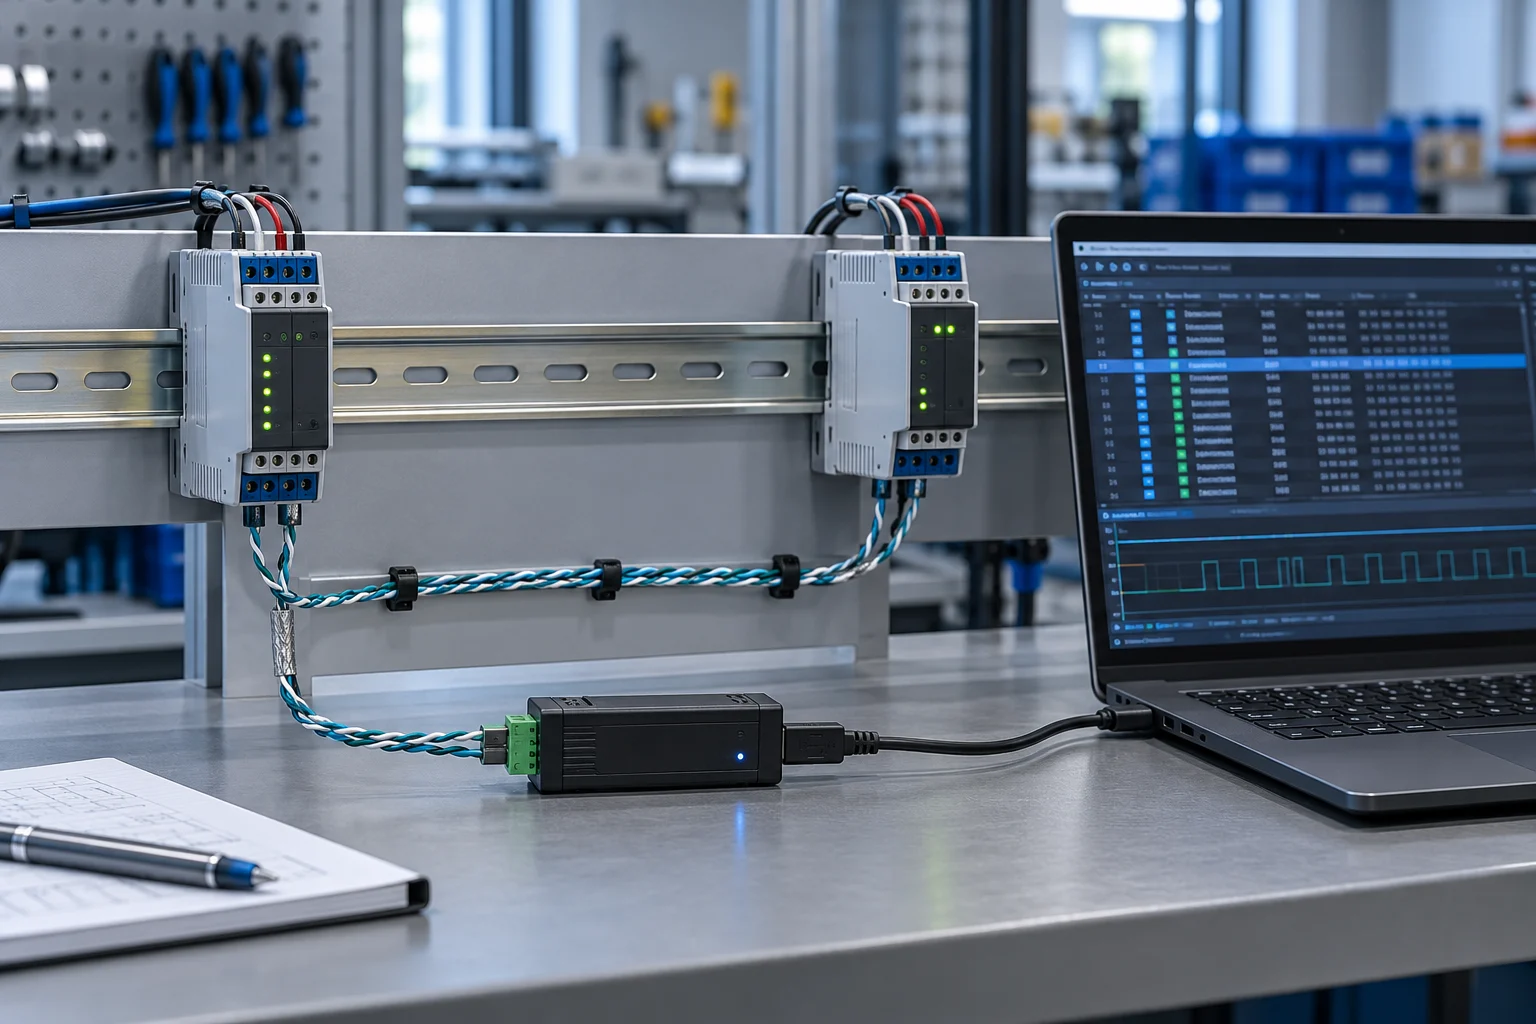
Making production data visible does not have to start by connecting a large monitoring system to every machine. Establishing a correct time model and reliable counter on one critical machine is more useful than a comprehensive but inconsistent dashboard. OEE is a supporting indicator in this work: the aim is to identify the causes of losses, rather than simply increase a percentage.
01Keep the three OEE components separate
OEE is expressed as the product of availability, performance and quality. Availability describes how much of the planned production time the equipment actually runs; performance describes how closely it approaches the ideal speed while running; quality describes the proportion of total output that meets requirements first time.
This distinction matters. If reducing downtime also produces more defective products, a single overall percentage does not explain the situation adequately. Two shifts with the same OEE may need different improvements. Decisions should consider the components together with the causes of losses.
02Define the time model first
Define how shift duration, planned production time, planned shutdowns, product changeovers and breakdown downtime are classified. Comparisons become meaningless if the same event is treated as non-production time on one shift and downtime on another. Develop this terminology together with the production, maintenance and quality teams.
Events such as product changeovers, minor stops and slow cycles must be explicitly represented in the time model. Removing periods from the production schedule to improve reported OEE does not eliminate the loss. Changes to the measurement model must also be versioned; historical trends should not be compared without explaining those changes.
03A hypothetical shift calculation
Suppose planned production time is 420 minutes and total downtime is 60 minutes. Running time is 360 minutes. Let the ideal cycle time be 1 second, total production 18,000 units and good output 17,100 units. Convert units to the same system before calculating.
| Component | Calculation | Result |
|---|---|---|
| Availability | 360 / 420 | %85,71 |
| Performance | 18.000 × 1 / 21.600 | %83,33 |
| Quality | 17.100 / 18.000 | %95,00 |
| OEE | 0,8571 × 0,8333 × 0,95 | Approximately 67.86% |
The same result can also be checked by dividing the ideal production time for good output by the planned production time: 17,100 seconds / 25,200 seconds. These example figures are not actual results from any factory; they illustrate the calculation method.
04Verify what the counter actually counts
A sensor pulse does not always represent one good product. Empty carriers, products passing more than once or sensor vibration can cause overcounting. The sources of total production and scrap data must be clear. Multipliers must also be defined for multi-cavity moulds or machines producing several parts per cycle.
Counter resets, power interruptions and data retransmission must also be planned. Recording the machine, product, time and data quality for each record makes comparison easier. When the connection fails, mark the data as unavailable instead of displaying zero production. Otherwise, a network fault may be reported as production downtime.
05Define the ideal cycle time for each product
A machine may run at different speeds for different products. Calculating the entire shift using one ideal cycle time gives misleading results. Define the product and conditions to which the ideal cycle applies. Performance consistently exceeding 100% generally calls for a review of the counter, time model or ideal cycle definition.
Operators should not be expected to enter lengthy explanations for every brief stop. A small number of meaningful reason groups may be sufficient initially. Store the automatically detected state separately from the reason entered later by the operator, so that the change history is retained.
06Make the dashboard support action
The initial dashboard can show the shift trend, the three components, the main causes of downtime and missing data. Instead of starting with dozens of indicators, assign an owner and a follow-up date to one or two losses. For example, a small change that reduces recurring waits for material feed may deliver value before a major software investment.
07Pilot acceptance criteria
Compare automatic data with manually recorded shift records. Test product changeovers, counter resets and network interruptions. Verify that the calculation can be reproduced from the same data. A successful pilot delivers more than an OEE percentage: it establishes reliable definitions, traceable data and a working process that supports improvement decisions.
08Example verification scenario
Suppose the first week of the pilot reveals a difference between the automatic counter and the total recorded manually at the end of the shift. First examine the counting point, products passing through more than once and records around shift boundaries. If scrap information arrives later than production data, define when the report becomes final. Setting performance targets on the dashboard before correcting the data may incentivise incorrect measurement. Pilot acceptance should assess not only calculation accuracy but also the traceability of the data source and correction history.
Technical references and further reading
For product- and version-specific values, the relevant manufacturer's current documentation should be taken as the reference. The calculations and scenarios above are engineering examples for illustrative purposes.